Windy integration is live — here's what it changes
We've embedded Windy directly into the voyage map. No more alt-tabbing between your chart and the forecast. Here's the full story.
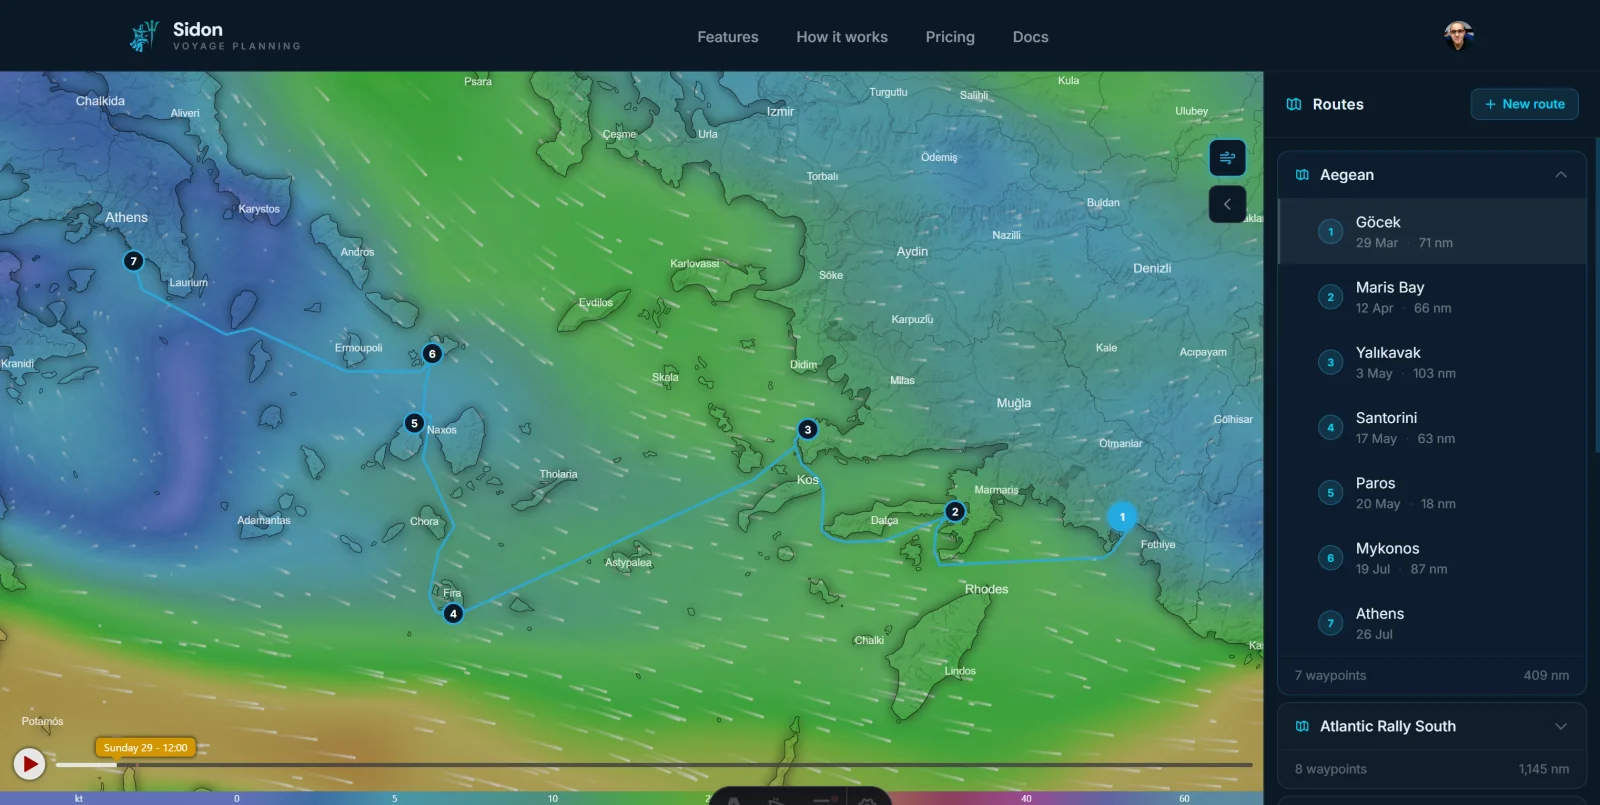
From today, Windy is embedded directly inside the Sidon voyage map. You can toggle it on with the weather button in the top-right controls, choose your overlay (wind, waves, pressure, rain), and see the forecast layered directly on your route.
Why this matters
The workflow before this was: plan your route in Sidon, open Windy in a separate tab, drag the map to approximately where your route is, and try to mentally overlay the forecast on your planned track. It worked, but it broke the planning flow at exactly the moment you need continuous thinking — when you are deciding whether a weather window works for a specific leg.
Now the forecast and the route are in the same frame. You can see whether your planned departure for leg three puts you in the middle of a developing low, without leaving the app.
What overlays are available
The Windy integration exposes the full Windy overlay library:
- Wind — the default. Speed and direction, animated particles.
- Waves — significant wave height and direction.
- Rain/thunder — useful for coastal hops where squall activity matters.
- Pressure — for reading the synoptic pattern rather than the local conditions.
- Temperature — less useful for passage planning, more useful for provisioning.
We have defaulted to the wind overlay because it is the one sailors look at most. Your last-used overlay is saved to your account and restored when you return.
The technical bit
Windy’s embed API is a clean iframe-based integration. We load it on demand (only when you toggle it on) to keep the initial page load fast. The map state — your current centre point and zoom level — is passed to Windy on initialisation, so the forecast is centred on wherever you were looking in the chart.
The Windy layer sits in its own div, separate from the Google Maps layer. When you toggle back to the chart, Windy is suspended and the map resumes exactly where you left it.
What’s next
The next step is making the weather data actionable inside the route planner itself — showing forecast conditions at each waypoint for your planned arrival time, so you can see at a glance whether each leg has a workable window. That work is ongoing.
For now: click the weather button, pick your overlay, and plan the passage.